The Challenge of Usefulness
There is more data everywhere, but it never seems to be in the right place at the right time in the right format.
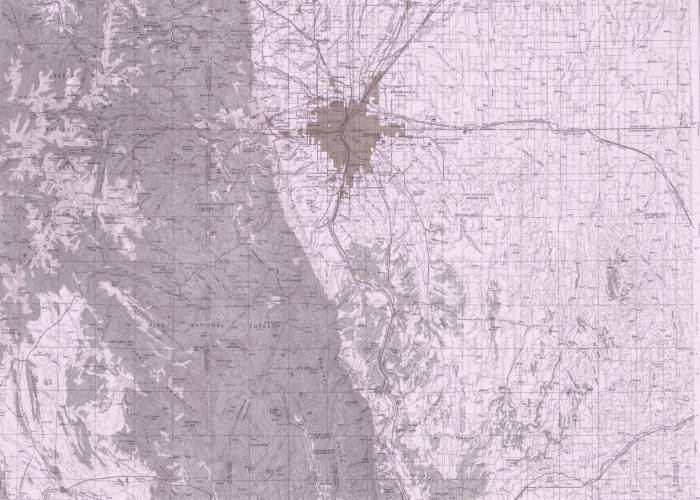
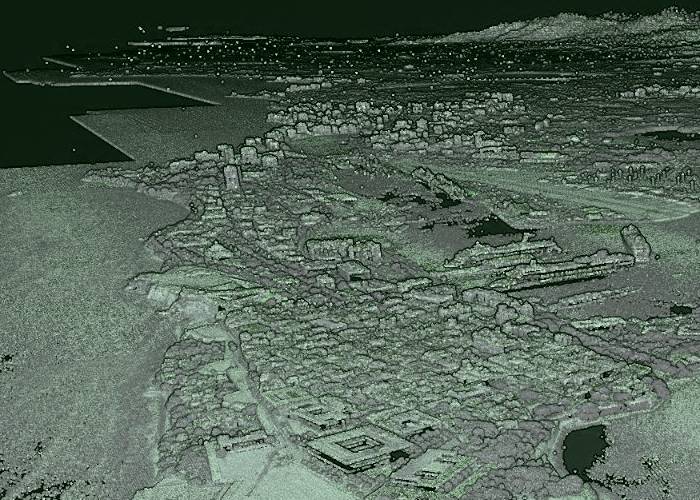
I work with data in its many forms: databases, APIs, spreadsheets, text files, and a wide variety of GIS formats.